Private Equity Value Creation: Strategic Portfolio Growth
Master private equity value creation strategies. Learn to drive operational alpha, execute buy-and-build, and maximize EBITDA expansion for superior exits.

Private equity firms face intensifying pressure to deliver returns in an era of elevated asset prices and limited leverage availability. The traditional playbook—relying on financial engineering and multiple expansion—has diminishing effectiveness. Today, sustainable outperformance stems from operational alpha: value created through tangible business improvements rather than balance sheet manipulation. This guide provides a battle-tested framework for systematic value creation across the private equity lifecycle, moving beyond generic advice to deliver executable strategies grounded in real-world implementation.
Table of Contents
- What Is Private Equity Value Creation?
- Operational Alpha vs. Financial Engineering: The Critical Shift
- The Operational Alpha Value Creation Framework (OAVCF)
- Decision Matrix: Selecting Value Creation Levers
- Stage-Based Guidance: From Deal Sourcing to Exit
- Use-Case Scenarios
- Risks, Constraints, and Trade-Offs
- Execution Checklists
- Conclusion: Building a Sustainable Value Creation Engine
What Is Private Equity Value Creation?
Private equity value creation encompasses all deliberate actions taken to increase a portfolio company’s enterprise value between acquisition and exit. Unlike passive public market investing, PE general partners actively engineer value through strategic, operational, and financial levers.
Snippet-ready definition: Private equity value creation is the active process of increasing a portfolio company’s enterprise value through strategic initiatives, operational improvements, and financial engineering during the investment horizon.
The most sophisticated firms now prioritize operational alpha—sustainable improvements to revenue growth, margin expansion, and capital efficiency—over temporary gains from leverage or multiple arbitrage. This shift reflects both market realities and LP demand for demonstrable skill in transforming businesses.
Operational Alpha vs. Financial Engineering: The Critical Shift
For decades, PE returns were driven primarily by financial engineering: using debt to amplify returns, timing market cycles for multiple expansion, and optimizing tax structures. While these tactics remain relevant, their marginal contribution has declined as debt markets have tightened and acquisition multiples have risen.
The table below contrasts the two approaches across key dimensions that determine long-term value creation sustainability.
| Dimension | Financial Engineering | Operational Alpha |
|---|---|---|
| Value Source | Debt leverage, multiple expansion | Revenue growth, margin improvement, capital efficiency |
| Sustainability | Typically reverses at exit | Creates enduring competitive advantages |
| Market Dependency | High (sensitive to credit cycles, sentiment) | Lower (driven by fundamental business performance) |
| Scalability | Limited by debt capacity | Scalable across portfolio and platform |
| LP Perception | Financial skill | Operational skill |
| Implementation Speed | Fast (weeks to months) | Slower (quarters to years) but more durable |
| Risk Profile | Execution risk modest; market risk high | Execution risk significant; market risk lower |
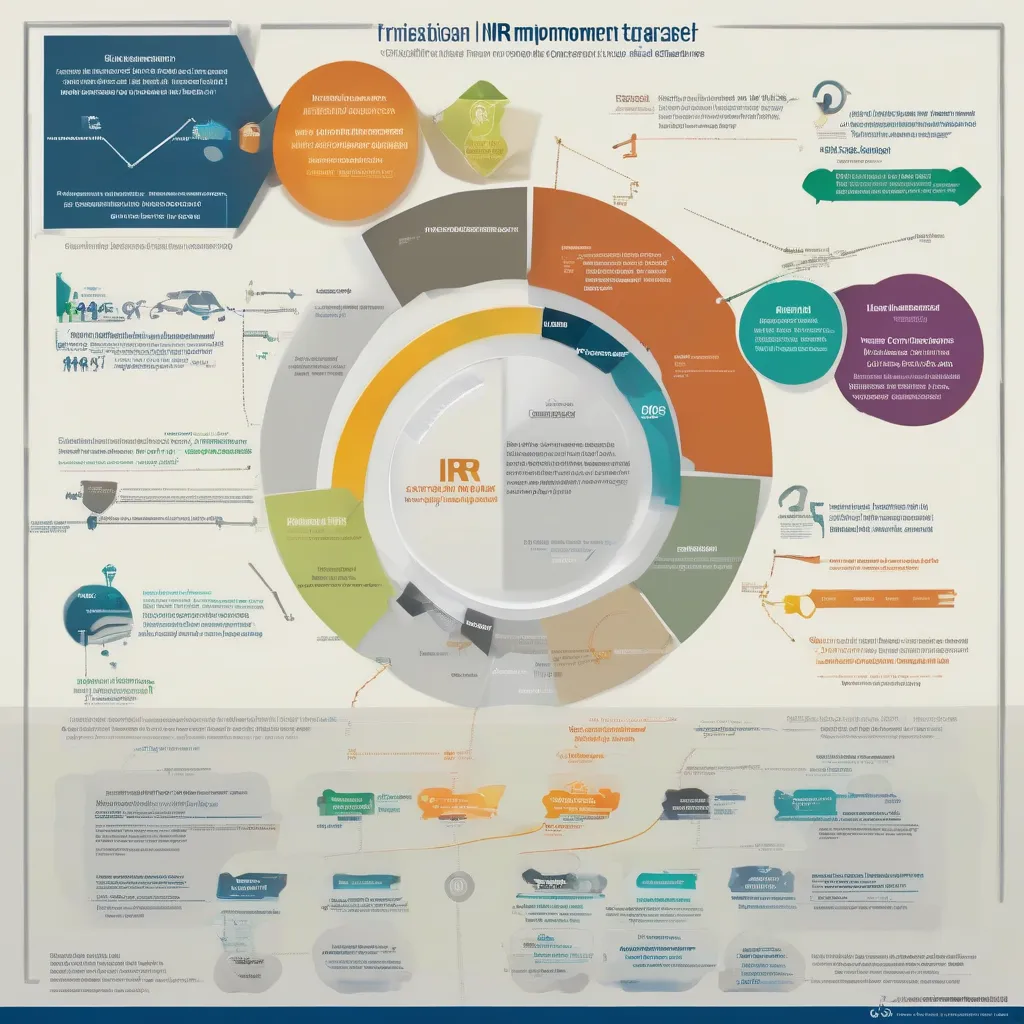
The data confirms this shift: top-quartile PE funds now attribute 60–70% of their outperformance to operational improvements, according to recent Bain & Company analysis. Firms clinging to financial-engineering-first approaches consistently underperform in volatile markets.
The Operational Alpha Value Creation Framework (OAVCF)
To operationalize the shift toward sustainable value creation, we introduce the Operational Alpha Value Creation Framework (OAVCF)—a proprietary model that structures value creation across four interconnected pillars. Unlike generic checklists, OAVCF provides a dynamic system for selecting, sequencing, and measuring value creation initiatives based on company-specific context and market conditions.
The four pillars are:
- Thematic Insight: Identifying secular trends and structural advantages
- Platform Integration: Building scalable operating models through buy-and-build
- EBITDA Expansion: Driving profitable growth and efficiency
- Exit Readiness: Positioning for maximum transaction value
Each pillar contains specific levers, with progress measured through leading and lagging indicators. The framework’s power lies in its insistence that value creation begins before the deal closes and intensifies through disciplined execution.
Pillar 1: Thematic Insight
Thematic insight involves identifying macro-level trends that create structural advantages for specific business models. This is not generic market research; it’s developing a point of view on how forces like regulation, technology adoption, or demographic shifts will reshape an industry’s economics over the investment horizon.
Key activities include:
- Mapping regulatory tailwinds (e.g., Inflation Reduction Act for clean energy)
- Analyzing technology adoption curves (e.g., AI workflow automation in professional services)
- Quantifying demographic-driven demand shifts (e.g., aging population impact on healthcare)
- Assessing supply chain reconfiguration opportunities (e.g., near-shoring resilience)
The output is a thematic thesis that guides target selection and value creation prioritization. For example, a firm identifying the secular growth of outpatient care might prioritize ambulatory surgery center acquisitions and invest in same-day surgery capacity expansion.
Pillar 2: Platform Integration
Platform integration leverages buy-and-build strategies to create scalable operating platforms with centralized functions and decentralized execution. This pillar transforms fragmented acquisitions into cohesive businesses with improved unit economics through scale.
Critical components include:
- Defining a clear platform “repeatable model” (standardized processes, technology stack, go-to-market)
- Establishing a rigorous integration playbook (IT, HR, finance systems harmonization)
- Creating centralized shared services (procurement, talent acquisition, compliance)
- Implementing a decentralized P&L structure that preserves local accountability while enabling scale benefits
The metric of success is platform EBITDA margin expansion—measuring whether the integrated entity achieves better economics than the sum of its parts. This connects directly to our guidance on M&A integration strategies, which details the operational playbooks required for successful platform building.
Internal link: "M&A integration strategies" -> m-and-a-integration-strategies-post-merger-playbook.
Pillar 3: EBITDA Expansion
EBITDA expansion focuses on the twin levers of revenue growth and margin improvement through disciplined operational execution. This pillar moves beyond cost-cutting to sustainable profitability enhancement.
Revenue growth levers:
- Sales force effectiveness (territory design, compensation alignment)
- Product/service innovation (adjacent offerings, pricing optimization)
- Channel expansion (e-commerce, partnerships, geographic extension)
- Customer success and retention programs
Margin improvement levers:
- Procurement optimization (category management, supplier consolidation)
- Process automation (RPA, workflow digitization)
- Facility footprint optimization (lean manufacturing, space utilization)
- Working capital efficiency (inventory turns, receivables/payables timing)
The distinguishing factor is tying initiatives to specific, measurable EBITDA impact with clear ownership and timelines. Vague “improve operations” initiatives fail; specific “reduce logistics costs by 15% through network optimization by Q3” succeed.
Pillar 4: Exit Readiness
Exit readiness ensures that value created is transparent, sustainable, and credible to potential acquirers or public market investors. This pillar begins at investment, not as a pre-sale afterthought.
Key elements include:
- Standardizing reporting and KPI tracking to meet diligence expectations
- Documenting value creation initiatives with before/after metrics
- Ensuring management incentives align with post-exit ownership
- Addressing potential diligence red flags (customer concentration, key person dependency)
- Building a compelling growth narrative backed by operational data
Firms that neglect this pillar often experience “value leakage” at exit, where earnouts are triggered or valuations discounted due to perceived integration risk or sustainability concerns.
Decision Matrix: Selecting Value Creation Levers
Not all levers apply equally to every investment. The OAVCF includes a decision matrix to prioritize initiatives based on two axes: impact potential (high/low) and execution complexity (high/low). This ensures resources focus on high-impact, feasible initiatives first.
| Execution Complexity \ Impact Potential | High Impact | Low Impact |
|---|---|---|
| Low Complexity | Quick Wins (Prioritize First) Examples: pricing optimization, contract renegotiation, basic process automation |
Low Priority Examples: minor facility cosmetic updates, non-core reporting tweaks |
| High Complexity | Strategic Initiatives (Require Planning) Examples: platform integration, new product launch, market expansion |
Questionable Value Examples: extensive ERP overhaul with unclear ROI, speculative R&D |
This matrix prevents the common pitfall of embarking on high-complexity, low-impact projects that consume management bandwidth without moving the needle. It also ensures that quick wins—often overlooked in favor of glamorous transformations—are captured early to build momentum and credibility.
Stage-Based Guidance: From Deal Sourcing to Exit
Value creation is not a phase; it’s a continuous process requiring different emphasis at each investment stage. The following guidance maps OAVCF pillars to critical junctures, specifying what to focus on, who owns it, and how to measure progress.
Pre-Investment: Value Creation Due Diligence
Before signing, investors must move beyond financial due diligence to assess value creation potential. This is where many firms falter, relying on superficial operational checks rather than deep thematic and platform analysis.
Critical activities:
- Validate the thematic thesis with expert interviews and data analysis
- Stress-test platform integration assumptions (cost synergies, cultural fit)
- Quantify EBITDA expansion levers with bottom-up models (not top-down targets)
- Identify potential diligence risks for the exit readiness pillar
- Construct a value creation hypothesis with specific initiatives, owners, timelines, and expected EBITDA impact
Internal link: "value creation due diligence" -> private-equity-due-diligence-strategic-guide.
The output is not a thick binder but a concise value creation memorandum that aligns the investment team, operating partners, and future management on the plan’s logic and accountability.
Post-Acquisition: The First 100 Days
The first 100 days set the tone for the entire investment. Speed and focus are critical; attempting to boil the ocean guarantees failure. The priority is securing quick wins while laying the groundwork for strategic initiatives.
Actions by pillar:
- Thematic Insight: Communicate the thesis company-wide; begin collecting frontline feedback on its validity
- Platform Integration: If a buy-and-build, announce the platform vision; integrate one non-controversial function (e.g., travel procurement) to demonstrate capability
- EBITDA Expansion: Implement 2–3 high-impact/low-complexity initiatives from the decision matrix; establish a weekly value creation review cadence
- Exit Readiness: Standardize monthly reporting templates; begin documenting current-state processes for future improvement tracking
Key metric: Value creation initiative completion rate (target: 80% of planned 100-day initiatives completed on time).
Hold Period: Quarterly Value Creation Review
During the hold period, value creation shifts from initiation to optimization and scaling. The quarterly review cadence ensures accountability and allows for course correction based on emerging data.
Review agenda:
- Update EBITDA expansion initiative tracking (actual vs. planned impact)
- Assess platform integration progress (if applicable) with integration health surveys
- Test thematic thesis validity with new market data and customer feedback
- Refresh exit readiness materials with latest performance data
- Re-prioritize initiatives using the decision matrix based on new complexity/impact assessments
This process transforms value creation from a static plan into a dynamic, learning system. Firms that institutionalize this review consistently outperform those that treat value creation as a “set and forget” activity.
Pre-Exit: Maximizing Transaction Value
Six to twelve months before a targeted exit, focus shifts to de-risking the transaction and amplifying the value creation narrative. This is not about last-minute financial engineering but ensuring the operational improvements are transparent, sustainable, and compelling to buyers.
Critical steps:
- Conduct a “seller’s diligence” simulation to identify potential buyer concerns
- Quantify and package all value creation initiatives with third-party validation where possible
- Ensure management presentations lead with operational metrics, not just financials
- Address any lingering integration issues (especially for platform plays)
- Prepare a detailed value creation bridge showing EBITDA evolution from acquisition to projected exit
The goal is to make the value creation story so robust that it withstands rigorous buyer scrutiny and supports a premium valuation multiple.
Use-Case Scenarios
The following scenarios illustrate how the OAVCF applies across different sectors and investment theses, showing the framework’s adaptability while maintaining core principles.
SaaS Buy-and-Build Platform
A mid-market PE firm acquires a vertical SaaS provider serving dental practices with a thesis that practice consolidation and increasing regulatory compliance demands will drive sector growth.
- Thematic Insight: Aging population increases dental service demand; DSOs (Dental Service Organizations) growing at 15% CAGR create embedded market for practice management software
- Platform Integration: Acquired three complementary SaaS assets (patient scheduling, billing, clinical notes); integrated billing and scheduling platforms within 18 months; retained separate clinical notes for specialty differentiation
- EBITDA Expansion: Increased pricing by 8% annually tied to new feature releases; reduced customer acquisition cost by 22% through partnered referral programs with DSOs; improved gross margins from 68% to 76% via cloud infrastructure optimization
- Exit Readiness: Standardized SaaS metrics (NRR, GRR, LTV:CAC) audited by third party; documented integration playbook for buyer; retained key product and sales leaders via rollover equity
Result: 3.2x MOIC over 4.5 years, with 65% of returns attributed to operational improvements per post-mortem analysis.
Manufacturing Operational Transformation
A manufacturing-focused PE group acquires a mid-sized industrial components supplier facing margin pressure from overseas competition and customer concentration.
- Thematic Insight: Near-shoring trend driven by supply chain resilience needs creates opportunity for domestically manufactured, high-mix, low-volume components
- Platform Integration: Not applicable (single asset play); focused on operational standardization across three plants
- EBITDA Expansion: Implemented lean manufacturing cellular layout reducing work-in-process by 40%; renegotiated top 20 supplier contracts saving 12% COGS; launched customer-specific engineering service increasing attachment rates by 25%
- Exit Readiness: Built customer concentration mitigation plan showing top 10 customer dependence reduced from 65% to 45% over hold period; documented lean system for buyer transferability
Result: 2.8x MOIC over 5 years, with EBITDA margin expansion from 12% to 18% driving 55% of value creation.
Healthcare Consolidator Platform Scaling
A healthcare-specialized PE firm builds a platform in outpatient physical therapy, anticipating demographic-driven demand growth and shift toward value-based care.
- Thematic Insight: Aging baby boomers increase musculoskeletal service demand; Medicare value-based care models reward functional outcomes over visit volume
- Platform Integration: Acquired 12 regional PT chains over 3 years; implemented centralized EHR, billing, and credentialing; allowed local clinical autonomy with centralized outcomes tracking
- EBITDA Expansion: Improved therapist utilization from 65% to 78% via automated scheduling; reduced administrative costs per visit by 30% through shared services; launched outcomes-based contracts with two major health systems
- Exit Readiness: Created standardized outcomes dashboard demonstrating 15% better functional improvement vs. national benchmarks; structured management equity to retain key regional operators post-exit
Result: Achieved platform scale of $450M revenue; attracted strategic buyer paying 14x Adjusted EBITDA due to defensible market position and proven outcomes model.
Risks, Constraints, and Trade-Offs
Operational alpha creation is not without hazards. Awareness of common failure modes enables proactive mitigation.
Common Failure Modes
- Thematic Misdiagnosis: Betting on a trend that fails to materialize or is already priced in (mitigation: use scenario planning, not single-point forecasts)
- Integration Overestimation: Assuming synergies are easier to achieve than reality (mitigation: bottom-up integration planning with frontline involvement)
- Initiative Sprawl: Pursuing too many levers simultaneously, diluting focus (mitigation: strict application of the decision matrix with quarterly re-prioritization)
- Management Misalignment: Incentives not tied to value creation milestones (mitigation: rollover equity linked to specific operational targets)
- Exit Readiness Neglect: Assuming value speaks for itself without transparent demonstration (mitigation: begin exit readiness documentation at day one)
Constraints and Trade-Offs
- Time Horizon: Operational improvements take longer to materialize than financial engineering—requires LP patience and GP staying power
- Management Bandwidth: Operational transformation demands significant CEO and COO time; must backfill or risk neglecting core operations
- Measurement Lag: Some initiatives (e.g., culture change, brand building) have delayed financial impact—requires leading indicator tracking
- Opportunity Cost: Focusing on operational levers may mean deprioritizing complementary financial optimizations (e.g., further add-on acquisitions)
The trade-off is clear: operational alpha creation demands more skill, patience, and organizational alignment than financial engineering, but delivers more durable, scalable, and defensible value.
Execution Checklists
Structured checklists prevent omission and ensure discipline. Use these as living documents adapted to each investment’s context.
Pre-Investment Value Creation Assessment Checklist
- Thematic thesis validated with at least three expert sources and primary data
- Platform integration synergies modeled bottom-up with integration workstream leads
- EBITDA expansion levers quantified using the decision matrix (high impact/low complexity prioritized)
- Management team interviewed for capacity and willingness to execute specific initiatives
- Exit readiness risks identified (customer concentration, key person dependency, documentation gaps)
- Value creation hypothesis documented with specific initiatives, owners, timelines, and expected EBITDA impact
- Threshold check: Does the plan generate at least 30% of total expected return from operational improvements? (If no, revisit thesis)
Post-Acquisition First 100 Days Plan Checklist
- Day 1–10: Secure thematic thesis communication; begin 30-day listening tour with customers and employees
- Day 11–30: Implement first quick win (e.g., pricing adjustment, contract renegotiation); establish weekly value creation review
- Day 31–60: If platform play, integrate first non-core function (e.g., travel procurement); map as-is processes for top 3 EBITDA levers
- Day 61–100: Implement second quick win; begin detailed planning for first strategic initiative; update value creation hypothesis with early learnings
- Day 100: Hold formal 100-day review with investment committee; reset expectations for next quarter based on results
Quarterly Value Creation Review Checklist
- Update all EBITDA expansion initiative trackers with actuals vs. plan
- Re-survey thematic thesis validity with new market/competitive data
- If platform integration: assess integration health via pulse survey and milestone tracking
- Refresh exit readiness package with latest financial and operational results
- Re-prioritize initiatives using decision matrix based on updated impact/complexity assessments
- Document key learnings and update value creation playbook for future investments
Conclusion: Building a Sustainable Value Creation Engine
Private equity value creation has evolved. The era of relying primarily on financial engineering is behind us. Today’s market demands demonstrable skill in transforming businesses through operational excellence. The firms that will consistently outperform are those that treat value creation not as a series of isolated projects, but as a repeatable, scalable engine built on deep thematic insight, disciplined execution, and transparent accountability.
The Operational Alpha Value Creation Framework (OAVCF) provides the structure for this engine—moving beyond vague aspirations to specific, measurable initiatives with clear ownership and timelines. By integrating the four pillars of thematic insight, platform integration, EBITDA expansion, and exit readiness, and applying the decision matrix to focus resources, PE general partners can navigate the complexities of operational transformation with greater predictability and success.
Remember: operational alpha is not about perfection on day one. It’s about beginning with a credible hypothesis, executing with discipline, learning from results, and continuously refining the approach. The most successful PE firms view value creation as a core competency—continually honed through each investment—rather than a one-off project checklist. Build that competency, and superior returns will follow.
Internal link: "build a future-proof competitive edge" -> ai-business-strategy-build-a-future-proof-competitive-edge.
Share this article
Related Articles

Growth Equity: Investing Strategy
Master strategic growth equity investing. Learn about growth capital, venture capital vs. buyout structures, preferred equity, and LTV/CAC ratios in 2026.

Tail Risk Hedging
Master strategic tail risk hedging for portfolio protection. Learn about put options, VIX derivatives, negative carry costs, and convexity in 2026.

Leveraged Buyouts: Strategic Growth & Investing
Master Leveraged Buyouts. Learn LBO capital stacks, senior vs. mezzanine debt, valuation multiples, VODA analytics, and risk factors in 2026.

High-Yield Bonds: Strategic Investing for Income
Master high-yield bonds. Learn about speculative-grade ratings, credit spreads, default risk, yield-to-worst (YTW), and duration in 2026.